The following graph from the post struck me as very useful, especially as so much bond discussion tends to have short memories.
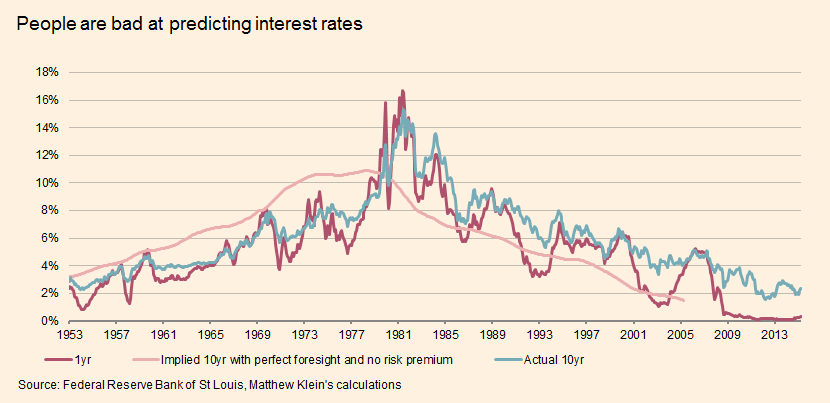
If the 10 year rate had followed the pink line, you would not have made any more buying 10 year bonds than buying short term bonds. (The pink line is the forward-looking moving average of the one year rates.)
What the graph shows beautifully, then, is this: Until 1981, long-term bonds were awful. You routinely lost money buying 10 year bonds relative to buying one year bonds. It goes on year in and year out and starts to look like a constant of nature.
From 1981 until today, the actual 10 year rate has been well above this ex-post breakeven rate. It's been a great 35 years for long-term bond investors. That too seems like a constant of nature now.
Of course, inflation going down was good for long term bonds. But we usually don't think there can be surprises in the same direction 35 years in a row.
You can also see the steady 35 year downward trend in 10 year rates. Good luck seeing the "massive" effects of quantitative easing or much of anything else here.
A lot of academic papers are devoted to this risk premium in bonds, including "Decomposing the yield curve" that I wrote with Monika Piazzesi.
It is now routine to decompose the spread between long and short term bonds into an expectations component and a risk premium, with changes in risk premium accounting for "conundrums." It is also routine not to present standard errors of this decomposition. The one thing I know for sure is that there is a lot of uncertainty on that decomposition. Any risk-premium estimate comes down to a bond-return forecasting regression. We know how much uncertainty there is in that exercise.
The pink line looks like a bog standard lagged 10 year moving average. Is that correct?
ReplyDeleteHenry.
it's a forward-looking moving average, I think. The expectations hypothesis says that if the 10 year rate is the expected value of future 1 year rates, then you make no more money buying 10 year bonds than 1 year bonds.
DeleteDr. Cochrane,
ReplyDeleteYou write "Good luck seeing the "massive" effects of quantitative easing or much of anything else here."
I'd be very curious to know your opinion of this series of posts (links at the bottom) by Dr. Mark Sadowski (VAR and Granger causality studies in the "age of ZIRP"): particularly this one on bond yields.
Thanks.
Mark, I know you're out there. You seem to instantly be aware anytime your name is mentioned. What do you make of Cochrane's statement? What about his statement in his next post (regarding what he left out of his recent WSJ piece)? He mentions the empirical evidence there more directly.
DeleteJohn,
ReplyDelete"It is now routine to decompose the spread between long and short term bonds into an expectations component and a risk premium, with changes in risk premium accounting for conundrums."
Curious that tax policy (and expectations on tax policy) are not incorporated into interest rate expectations (both short term and long term), even though federal interest expense is paid out of tax revenue.
In any other lending arrangement, the first thing the lender looks at is the borrower's income history and prospects for future income. Why would the federal government be any different?
Without analysis, first thing that comes to my mind looking at that graph:
ReplyDelete1. Until early '80s people (investors) were bad at assessing how much inflation will there really be in the next ten years.
2. After central bank killed inflation, people still do not believe that central bank can and will keep inflation at or below 2%.
The second point seems to be consistent with other current data. Despite all the discussions in the FED that it is not acceptable to allow inflation to reach even 2.25% for one quarter (the inflation series they consider most appropriate) in order to ensure that tightening is not premature, data fronm the markets suggests that investors expect long-term inflation between 2.5% and 3%, if I remember correctly.
"But we usually don't think there can be surprises in the same direction 35 years in a row."
ReplyDeleteIs it 35 years or 3.5 non-overlapping decades? If interest rates are lower than expected over years 0-10, then there is a good chance that they will also be lower than expected over years 1-11. If one only had 6 days of stock market returns and the market rose the first 3 days and fell the next three, would we think it strange that the market could be surprised over such long periods?
Separate question on the duration risk premium: were there many papers in the late 70s on a "duration discount", a yield discount that long-term savers were willing to accept to remove the risk in their long-term returns? If net debt in the aggregate is zero, should it be the borrowers or the lenders that receive a risk premium for bearing duration risk?
I mean what banker doesn't want unlimited ZERO rate money to borrow trillions to manipulate any market anywhere! Yellen's speaking fees are going to be very very high!
ReplyDelete